

The latest data from Roy Morgan found nearly all of us (96 per cent) prefer to buy locally made products, a figure unchanged since last year. Next in line in terms of preference was New Zealand (60 per cent), the UK (57 per cent), and US (54 per cent).
Roy Morgan CEO Michele Levine said while the figure was unchanged year-on-year, support for Australian-made rose after the onset of Covid.
“Support for buying Australian-made goods shot-up during 2020 and the first year of the pandemic and has remained high ever since as the closure of international borders and restrictions on travel during the last two years has clearly boosted the attraction of buying locally made goods,” Levine said.
The figures come a week after Australian Made Week, a campaign to encourage consumers to buy locally made products and the importance of the green-and-gold kangaroo logo to guarantee authenticity.
Australian Made chief executive Ben Lazzaro said, “The pandemic has really opened many people’s eyes to the importance of locally made products and how we can all play our part, including businesses, by prioritising Aussie products to help strengthen the economy.
“When you buy Australian Made, you have a direct economic impact on the livelihoods of hundreds of thousands of Australians throughout the supply chain.”
KPMG’s 2021 Family Business Survey found 67 per cent of all businesses in Australia are family-owned and operated, with more than half of the nation’s workforce employed by a family business.
Countries of preference
Levine said while Australian-made goods have easily retained pole position, there were several countries which saw preference for their goods rise significantly over the last year.
The US, Singapore, and Malaysia all had a five per cent bump to 54, 39, and 25 per cent respectively.
And where there are winners, there are losers.
“The trading relationship between China and Australia has deteriorated significantly over the last two years with the former government’s call for an international investigation into the origins of COVID-19 proving particularly irritating for the Chinese Government.
“In response to these calls the Chinese government slapped tariffs and import restrictions on a range of Australian goods including wine, barley, lobsters, coal, timber, red meat and cotton,” Levine said.
That said, this year’s figure of 65 per cent being less likely to buy a product made in China, it had improved 5 per cent on last year, and up 21 per cent on 2020.
“The two-way trade between the two nations was valued at $264 billion in 2019/20 , well over three times the value of two-way trade with Australia’s second largest trading partner the United States ($81 billion).
“Most of that trade is also in Australia’s favour with local exports to China valued at around $177 billion – around two-thirds of the total value of trade,” she said.
Levine noted a clear split between generations in attitudes to trade with China. More than 70 per cent of Pre-Boomers (born pre-1946) and Baby Boomers (born 1946-1960) said they would be ‘less likely’ to buy a product marked as ‘made in China’ compared to a bare majority of 56 per cent of those in Generation Z (born 1991-2008).
According to the Department of Foreign Affairs and Trade (DFAT), Australia’s leading trading partners in 2019/20 were:
- China (Including Hong Kong) ($264.3bn)
- USA ($80.8bn),
- Japan ($79.1bn),
- South Korea ($38.9bn),
- UK ($36.7bn),
- Singapore ($31.3bn),
- New Zealand ($28.7bn)
- India ($26.2bn)
- Germany ($21.8bn)
- Malaysia ($21.6bn)
Roy Morgan’s research looked at that top 10 against the percentage of people more likely to buy products depending on country of origin, 2021 vs 2022.
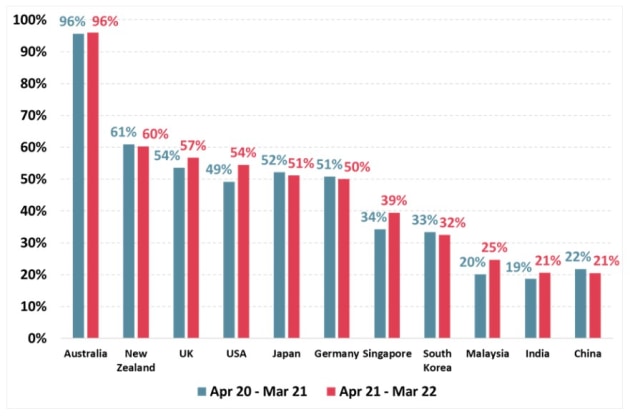
% of people more likely to buy products depending on country of origin, 2021 vs 2022.
(Source: Roy Morgan Single Source (Australia))
Of those in the top 10, preferences for goods rose in five countries, including the UK and US, and for three countries in the Asia-Pacific region led by Singapore on 39 per cent (up 5 per cent), Malaysia on 25 per cent (up 5 per cent points) and India on 21 per cent (up 2 per cent points).
There were four other countries, apart from New Zealand, for which the preference for their goods fell slightly during 2022. These countries included Japan on 51% (down 1% point), Germany on 50% (down 1% point), South Korea on 32% (down 1% point) and China on only 21% (down 1% point).
Overall, of twenty-one countries Australians were asked this question about, preference for goods rose for fifteen countries, fell for another five countries, and was unchanged for only one country – Australia.


